

Table of Contents
1. Introduction
Many times you need to analyze quickly audit logs to find suspicious event. For permanent solution you will utilize Elastic Agent but what if you want to do ad hoc search without need to create complicated data flow?
There is perfect solution for you. Just modify a little bit audit logs JSON file and load it with bulk API. Simple and works, I will show you how.
2. Start Elasticsearch and Kibana
Run below one by one to start both Elastic and Kibana containers.
					docker network create elkai

docker run --rm \
--name elk \
--net elkai \
-e ES_JAVA_OPTS="-Xms4g -Xmx4g" \
-e xpack.license.self_generated.type=trial \
-e xpack.security.audit.enabled=true \
-d \
-p 9200:9200 \
docker.elastic.co/elasticsearch/elasticsearch:8.15.2

docker exec -it elk bash -c "(mkfifo pipe1); ( (elasticsearch-reset-password -u elastic -i < pipe1) & ( echo $'y\n123456\n123456' > pipe1) );sleep 5;rm pipe1"

RESPONSE_JSON=`curl -k -XGET -u elastic:123456 "https://localhost:9200/_security/enroll/kibana"`
http_ca=$(echo "$RESPONSE_JSON" | jq -r '.http_ca')
kibanatoken=$(echo "$RESPONSE_JSON" | jq -r '.token.value')
echo "$http_ca" | sed 's/^/-----BEGIN CERTIFICATE-----\n/; s/$/\n-----END CERTIFICATE-----/' > http_ca.crt

docker run --rm \
--name kibana \
--net elkai \
-v ./http_ca.crt:/http_ca.crt \
-d \
-p 5601:5601 \
-e ELASTICSEARCH_SSL_VERIFICATIONMODE=certificate \
-e ELASTICSEARCH_HOSTS=https://elk:9200 \
-e ELASTICSEARCH_SERVICEACCOUNTTOKEN=$kibanatoken \
-e ELASTICSEARCH_SSL_CERTIFICATEAUTHORITIES=/http_ca.crt \
docker.elastic.co/kibana/kibana:8.15.2
3. Load logs to Elasticsearch
3.1. Collect logs from running container
Run below to get some sample
docker logs elk | grep '{"type":"audit"' > audit.json
This is example to show you quickly how it works. On real deployment you will have a file like /var/log/elasticsearch/server_audit.json
Official docker images of Elasticsearch redirect all logs to standard output (stdout), which is your console.
3.2. Prepare logs to load
Please use below script to split JSON file into multiple files ready to use in _bulk commands. Edit max_rows to 200000 if you plan to load bigger file.
This Bash script splits a large JSON file (audit.json) into smaller files, each containing a maximum of 600 rows (or fewer for the last file). It iterates through the input file line by line. For every line in the input, it adds a corresponding {“index”: {}} line before it in the output file. This pairing is commonly used for indexing documents in Elasticsearch.
The script names output files with a prefix (output_) and a sequence number (e.g., output_1.json, output_2.json, etc.). A new output file is created when the line count reaches the max_rows limit or at the beginning of processing. Status messages, including file creation and closure information, are printed to standard error (stderr). Finally, the script reports the total number of output files created.
					#!/bin/bash

input_file="audit.json"  # Replace with your input file
output_prefix="output_"
max_rows=600

file_count=1
line_count=0

while IFS= read -r line; do
  if (( line_count >= max_rows || line_count == 0 )); then
    if [[ -f "$output_file" ]]; then
      >&2 echo "Closing file: $output_file"  # Redirect status messages to stderr
    fi
    output_file="${output_prefix}_${file_count}.json"
    file_count=$((file_count + 1))
    line_count=0
    >&2 echo "Creating file: $output_file"
  fi

  echo '{"index": {}}' >> "$output_file"
  echo "$line" >> "$output_file"
  line_count=$((line_count + 2))
done < "$input_file"


>&2 echo "Processing complete. $(($file_count - 1)) files created."  # Final status message
You should see output when running script
					sh audit_log_splitter.sh
Creating file: output__1.json
Closing file: output__1.json
Creating file: output__2.json
Closing file: output__2.json
Creating file: output__3.json
Closing file: output__3.json
Creating file: output__4.json
Closing file: output__4.json
Creating file: output__5.json
Closing file: output__5.json
Creating file: output__6.json
Processing complete. 6 files created.
You can check format
					head -2 output__1.json
{"index": {}}
{"type":"audit", "timestamp":"2025-01-16T15:02:30,140+0000", "cluster.uuid":"f-RIrS9fQ-ylbmddaMzX-g", "node.id":"nOeSykkvRgWBF2ak2HR4Eg", "event.type":"transport", "event.action":"access_granted", "authentication.type":"REALM", "user.name":"elastic", "user.realm":"reserved", "user.roles":["superuser"], "origin.type":"rest", "origin.address":"172.16.238.10:58426", "request.id":"31n-K8PqQpSwAxaMb60LLA", "action":"cluster:monitor/health", "request.name":"ClusterHealthRequest", "indices":[]}
3.3. Load logs using _bulk API
Use below command to upload them all at once.
printf "%s\0" output_*.json | xargs -0 -P 0 -I {} curl -k -u elastic:123456 -XPOST -H "Content-Type: application/json" "https://localhost:9200/audit_logs/_bulk" --data-binary "@{}" > /dev/null
printf “%s\0” output_*.json: This creates a null-separated list of the output_*.json files. The null separator is crucial for handling filenames with spaces or special characters.
xargs -0 -P 0 -I {} …: This uses xargs to process the null-separated list.
-0: Handles null-separated input.
-P 0: Runs the command in parallel with as many processes as possible (maximum parallelization).
-I {}: Replaces {} with each filename from the list.
curl -k -u elastic:123456 -XPOST -H “Content-Type: application/json” “https://localhost:9200/audit_logs/_bulk” –data-binary “@{}”: This is the core command executed for each file.
curl: A command-line tool for transferring data with URLs.
-k: Disables SSL certificate verification (use with caution).
-u elastic:123456: Authenticates with Elasticsearch using username “elastic” and password “123456”.
-XPOST: Specifies an HTTP POST request.
-H “Content-Type: application/json”: Sets the content type header.
“https://localhost:9200/audit_logs/_bulk”: The Elasticsearch bulk API endpoint. audit_logs is the index name.
–data-binary “@{}”: Sends the contents of the file specified by {} (the current output_*.json file) as the request body.
> /dev/null: Redirects the output of the curl commands to /dev/null, effectively suppressing the output so you will not see all inserted rows …
3.4. Verify that data was loaded successfully.
curl -k -u elastic:123456 -XGET "https://localhost:9200/audit_logs/_count?pretty"
					{
  "count" : 1746,
  "_shards" : {
    "total" : 1,
    "successful" : 1,
    "skipped" : 0,
    "failed" : 0
  }
}
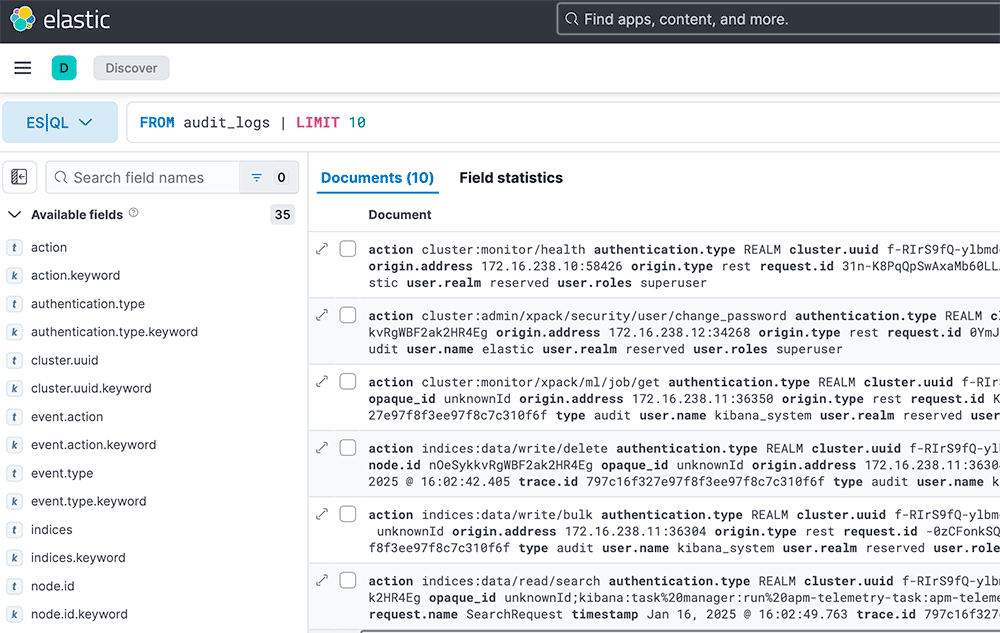
4. Kibana view
Open Kibana and see with ES|QL query security events.
4.1. Field statistics
With fields stats tab you can get quick overview what’s going on in the cluster. For example you can see how users authenticate to the cluster
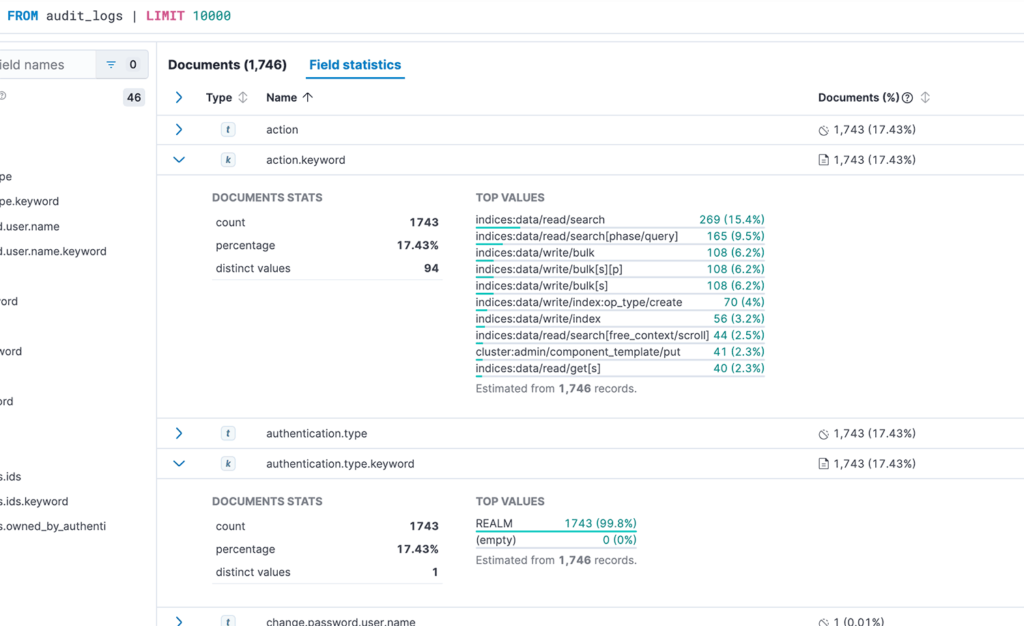
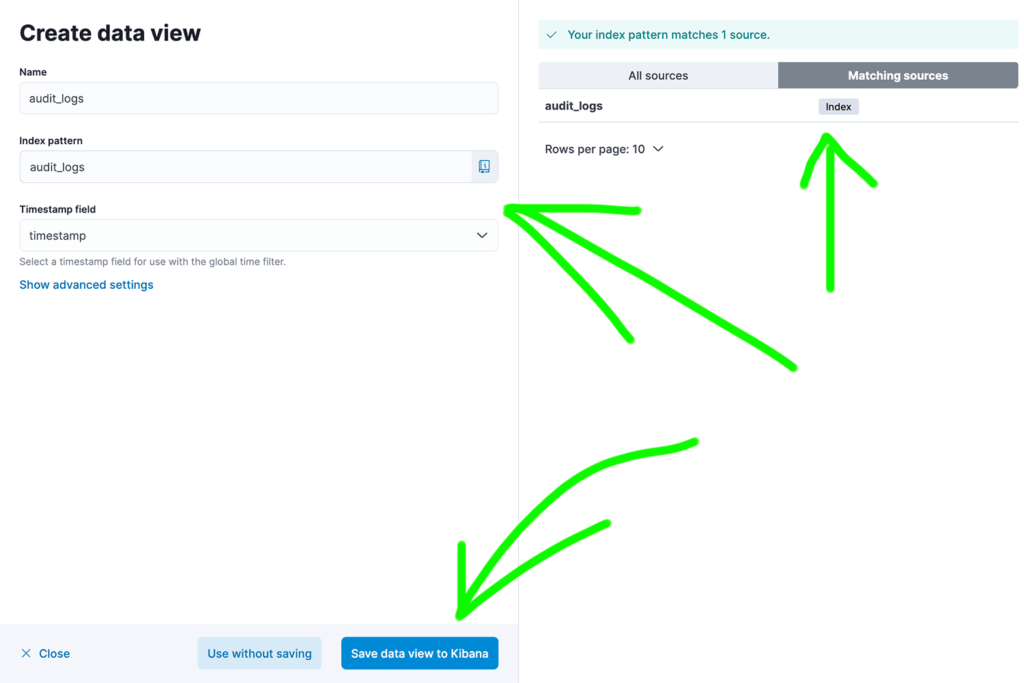
You can also create data view and perform full text searches in Discovery panel.
5. Summary
In this tutorial you have learned how to quickly load audit logs to Elasticsearch without creating complicated pipelines. Then you explored Kibana to see field statistics and potentially perform full text searches.
Have a nice coding!