Table of Contents
1. Introduction
It is possible to join 2 indexes based on their Geo Spatial data. In this tutorial I will show you how to create Crime Map in the New York City by mixing neighborhood polygons and GPS crime events coordinates.
2. Startup Elasticsearch and Kibana
Please run below commands one after another to start Elasticsearch cluster along with Kibana. Wait a moment before resetting password for Elasticsearch and before starting Kibana, by moment I mean 10 seconds should be enough.
					docker network create elkai

docker run --rm \
--name elk \
--net elkai \
-e ES_JAVA_OPTS="-Xms4g -Xmx4g" \
-e xpack.license.self_generated.type=trial \
-d \
-p 9200:9200 \
docker.elastic.co/elasticsearch/elasticsearch:8.15.2

docker exec -it elk bash -c "(mkfifo pipe1); ( (elasticsearch-reset-password -u elastic -i < pipe1) & ( echo $'y\n123456\n123456' > pipe1) );sleep 5;rm pipe1"

RESPONSE_JSON=`curl -k -XGET -u elastic:123456 "https://localhost:9200/_security/enroll/kibana"`
http_ca=$(echo "$RESPONSE_JSON" | jq -r '.http_ca')
kibanatoken=$(echo "$RESPONSE_JSON" | jq -r '.token.value')
echo "$http_ca" | sed 's/^/-----BEGIN CERTIFICATE-----\n/; s/$/\n-----END CERTIFICATE-----/' > http_ca.crt

docker run --rm \
--name kibana \
--net elkai \
-v ./http_ca.crt:/http_ca.crt \
-d \
-p 5601:5601 \
-e ELASTICSEARCH_SSL_VERIFICATIONMODE=certificate \
-e ELASTICSEARCH_HOSTS=https://elk:9200 \
-e ELASTICSEARCH_SERVICEACCOUNTTOKEN=$kibanatoken \
-e ELASTICSEARCH_SSL_CERTIFICATEAUTHORITIES=/http_ca.crt \
docker.elastic.co/kibana/kibana:8.15.2
3. Load test data
3.1. Mapping definition
To create mapping definitions for Elasticsearch indexes please run below commands
					curl -k -u elastic:123456 -XDELETE "https://localhost:9200/nyc_neighborhood"

curl -k -u elastic:123456 -XDELETE "https://localhost:9200/crime_events"


curl -k -XPUT -u elastic:123456 "https://localhost:9200/nyc_neighborhood" -H "Content-Type: application/json" -d'
{
  "mappings": {
    "properties": {
      "neighborhood": {
        "type": "keyword"
      },
      "borough": {
        "type": "keyword"
      },
      "location": {
        "type": "geo_shape"
      }
    }
  }
}'


curl -k -u elastic:123456 -XPUT "https://localhost:9200/crime_events" -H "Content-Type: application/json" -d'
{
  "mappings": {
    "properties": {
      "crime_type": { "type": "keyword" },
      "crime_timestamp": { "type": "date" },
      "crime_location": { "type": "geo_point" }
    }
  }
}'
please notice geo_shape and geo_point fields type used for location. Because neighborhood is area it should be represented via polygon and crime event is spot so therefore single point.
3.2. Bulk Load
I prepared detailed data for neighborhood and it contains ~600 lines therefore I won’t list it here instead please use bulk API to load it to ELK.
I uploaded them for you to IPFS network.
3.2.1. Download files from IPFS
					docker run --rm -it \
-v "$PWD:/tmp" \
-e IPFS_GATEWAY="https://ipfs.filebase.io/" \
curlimages/curl:8.5.0 --parallel --output "/tmp/#1.json" "ipfs://{QmaZD1xzi1MFf2MhjrZv7U2BGKji9U1jRB9im1MbbPG446,QmNNaC9AquYsQfRu5nqZgWcCjFKEAqv2XS1XgHw3Tut8ck}"


mv QmaZD1xzi1MFf2MhjrZv7U2BGKji9U1jRB9im1MbbPG446.json nyc_neighborhood_bulk.json

mv QmNNaC9AquYsQfRu5nqZgWcCjFKEAqv2XS1XgHw3Tut8ck.json crime_events.json
3.2.2. Load files to Elasticsearch
					curl -XPOST -u elastic:123456 "https://localhost:9200/nyc_neighborhood/_bulk" -H "Content-Type: application/json" -k --data-binary "@nyc_neighborhood_bulk.json" > /dev/null

curl -XPOST -u elastic:123456 "https://localhost:9200/crime_events/_bulk" -H "Content-Type: application/json" -k --data-binary "@crime_events.json" > /dev/null
3.3. Display loaded data
Go to Kibana Dev Console and run
					POST /_query?format=txt
{
    "query": """
        from nyc_neighborhood,crime_events
        | keep crime_type,crime_location,borough
    """
}
4. Join GeoSpatial dataset
4.1. Enrich Policy
In Elasticsearch world it is named as enriched. You are going to create enrich policy which will define lookup table containing key value pair
					DELETE _enrich/policy/what-is-area-name

PUT /_enrich/policy/what-is-area-name
{
  "geo_match": {
        "indices": "nyc_neighborhood",
        "match_field": "location",
        "enrich_fields": [
            "neighborhood" , "borough"
        ]
  }
}
It will grab fields from nyc_neighborhood index. Match field is key and enrich_fields will be values appended to index you will enrich in future via enrich processor or in ES|QL commands.
after policy is created you have to execute it
POST _enrich/policy/what-is-area-name/_execute
This is creating new system index with selected data. You can use ES|QL to display what is inside.
					POST _query?format=csv
{
  "query":"""
  from .enrich-what-is-area-name*
  | limit 1000
  """
}
This is your lookup table. From now you can perform join using it.
4.2. Joining data with ES|QL
Below queries will summarize crime events per region.
					POST /_query?format=txt
{
    "query": """
        from crime_events
        | keep crime_type,timestamp,crime_location
        | enrich what-is-area-name on crime_location
        | where borough is not null
        | limit 10
    """
}

POST /_query?format=txt
{
    "query": """
        from crime_events
        | keep crime_type,timestamp,crime_location
        | enrich what-is-area-name on crime_location
        | where borough is not null
        | stats howMany = count(*) by borough,crime_type
        | limit 10
    """
}
5. Visualization in Kibana
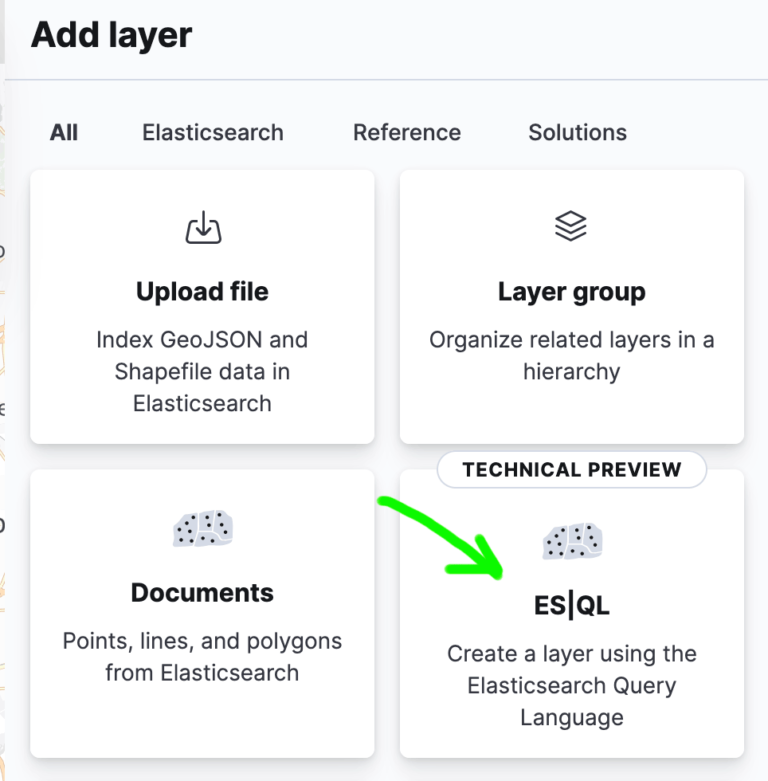
Please use Maps to create layers and make nice dashboard. When you add layer you can use ES|QL to get right data
Once you create 2 layers it should look like below
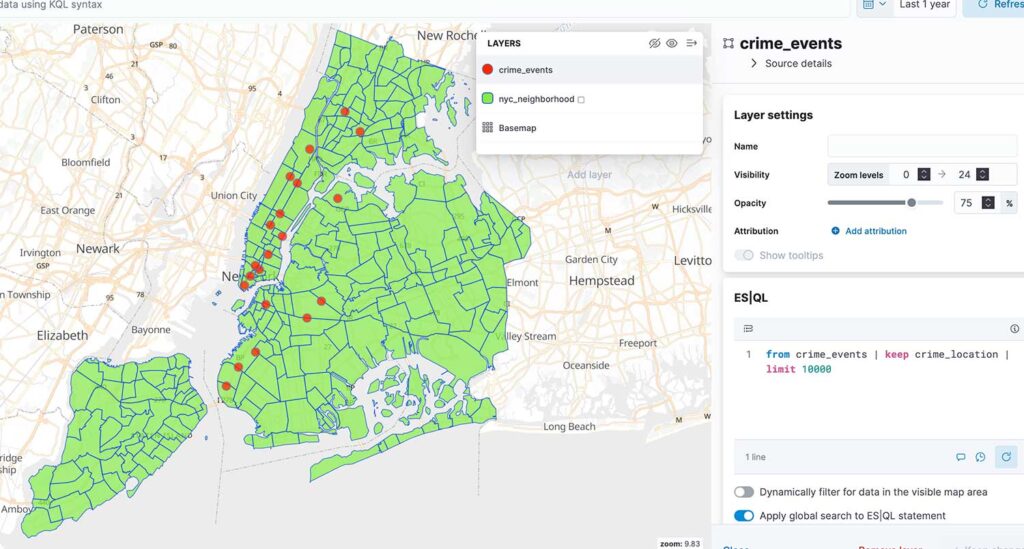
There are 2 ES|QL sources used:
					// for crime_events layer
from crime_events | keep crime_location | limit 10000

// for nyc_neighborhood layer
from nyc_neighborhood | keep location | limit 10000
6. Summary
In this tutorial you have learned how to match 2 different indexes on their geo spatial data and then create report with aggregation. You have also practiced how to create map in Kibana presenting GeoSpatial data.
Have a nice coding!