Table of Contents
1. Introduction
In multi user environment communication is crucial. Even in the middle of the night someone can try to perform extremely important dashboard in the Kibana and he has a absolutely right to do it. Therefore in case of planned maintenance is important to inform all users that potentially will be affected by change or outage during change execution. E-mailing people is of the common methods but due to swollen inboxes message can be lost and it will cause complaints later on. Much more smooth signal of upcoming maintenance will be informative banner displayed on every page being kind of embedded into UI graphic. In this article I will show you how to setup such banner without any coding.
2. Start Elastic and Kibana
Licensed version of Elasticsearch is required to configure banner. Perform commands in terminal to start
					docker network create kibana

docker run --rm \
--name elk \
--net kibana \
-d \
-p 9200:9200 \
-e xpack.license.self_generated.type=trial \
docker.elastic.co/elasticsearch/elasticsearch:8.10.1

# reset password
docker exec -it elk /usr/share/elasticsearch/bin/elasticsearch-reset-password -i -u elastic

# apply for new enrollment token
docker exec -it elk /usr/share/elasticsearch/bin/elasticsearch-create-enrollment-token -s kibana
Open another terminal and start Kibana
					docker run --rm \
--name kibana \
--net kibana \
-p 5601:5601 \
docker.elastic.co/kibana/kibana:8.10.1
Once it is started open in web browser http://localhost:5601?code=XXX where XXX is code displayed in Kibana stdout process. Place your enrollment token inside box and accept.
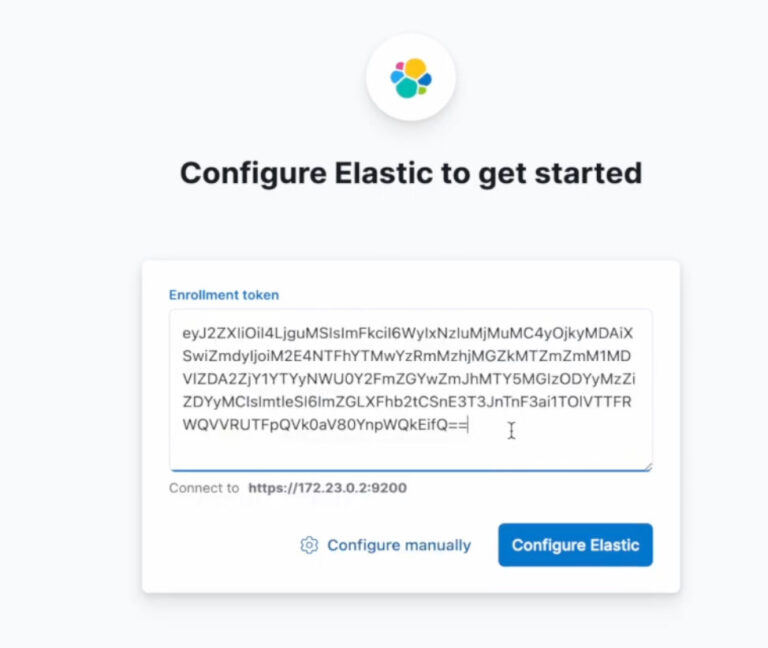
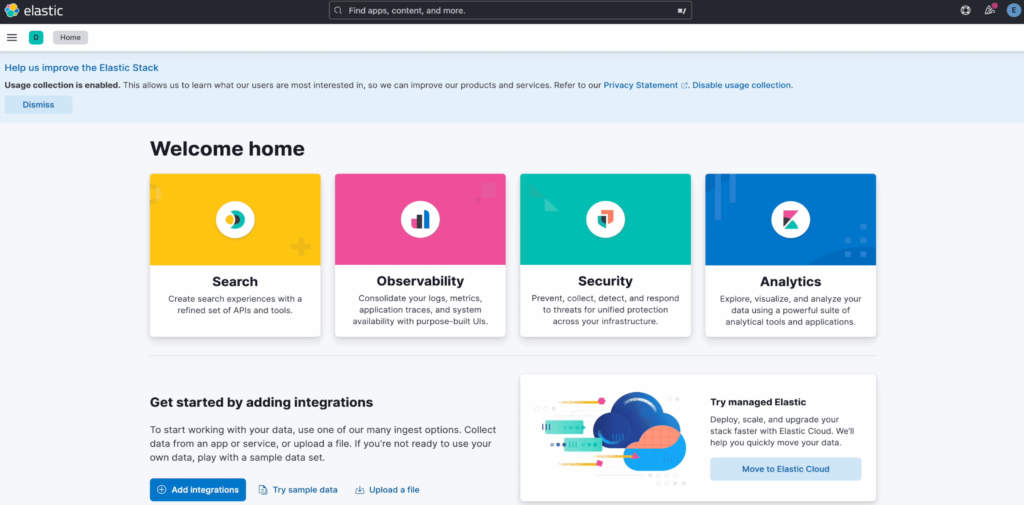
Elasticsearch and Kibana are connected and both up and running.
3. Activate banner
Go to main menu -> Stack management -> [Kibana] Advanced Settings
Then choose Category Banner to see only related options.
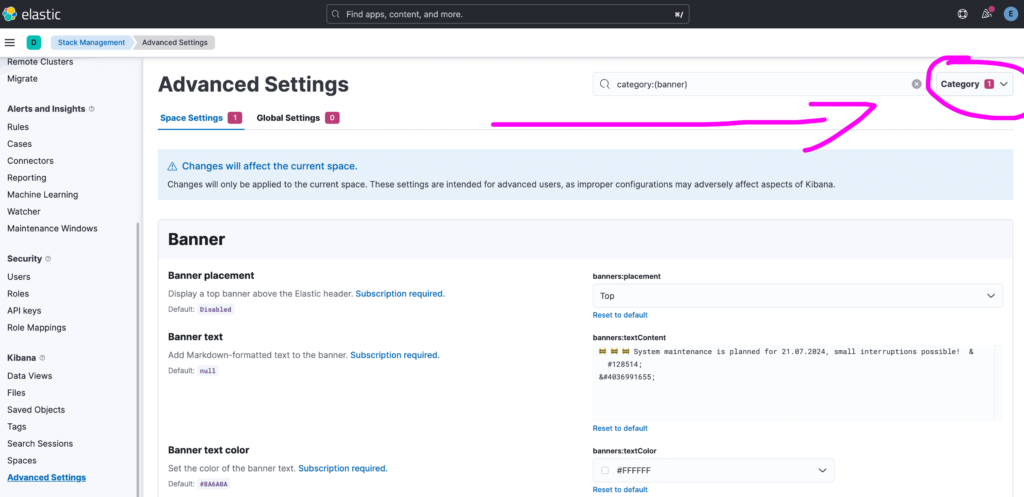
In the banner section there are 4 options to set.
Banner placement which is kind of toggle as there is only Top value that turn it on. You should set that option.
Banner text where you put the message for users. You can place emoji as well additionally to regular text. You can copy/paste these emoji from any webpage or put HTML code inside editor which after saving changes and reloading page will be render as emoji.
Example emoji code represent crying laugh
😂
Third parameter is “Banner text color” which basically set colour of text.
Last one is background colour called “Banner background color”.
I am suggesting you setting these colour with high contrast to each other so banner will not be blend in into Kibana colors and therefore will not be missed by users.
So text color as white #FFFFFF and background as red #FF0000 should make sense in this context. After making changes save them and reload page
Now beautiful panel is visible in top center of Kibana app.

4. Summary
You finished reading knowledge article about setting up information banner for Kibana. You learned how to do it and now you can use this knowledge everyday at work.
Have a nice coding!



2 Comments
Is elasticsearch now completly moving toward docker based in future ? Will docker based workload can handle same amount for log ingestion workload ?
Docker is one of the ways to start ELK cluster but it is definitely the easiest platform to make tutorials. This is because users do not need to start heavy Virtual Machine or arrange bare metal computing unit just to follow steps I am presenting.
In log ingestion the heaviest part is regular expression execution. The more regex, processing, filtering going on, the more CPU is utilized. If docker swarm or kubernates are setup properly they can let you run Elasticsearch good enough regarding performance. But it is always additional layer and if you do not need docker features stay with simple Elasticsearch process.